> For the complete documentation index, see [llms.txt](https://docs.devtodev.com/llms.txt). Markdown versions of documentation pages are available by appending `.md` to page URLs; this page is available as [Markdown](https://docs.devtodev.com/reports-and-functionality/project-related-reports-and-fuctionality/tuning.md).
# Tuning
Tuning section includes:
* [Paying capacity](/reports-and-functionality/project-related-reports-and-fuctionality/tuning.md#paying-capacity)
* [Cheaters & Testers](#cheaters-and-testers)
* [Labels](/reports-and-functionality/project-related-reports-and-fuctionality/tuning.md#labels)
* [Alerts](/reports-and-functionality/project-related-reports-and-fuctionality/tuning.md#alerts)
* [Integration](/reports-and-functionality/project-related-reports-and-fuctionality/tuning.md#integration): [Custom event configurations](#custom-event-configurations), [User properties](#user-properties), [System alerts](/reports-and-functionality/project-related-reports-and-fuctionality/tuning.md#system-alerts)
* [Raw Export](/reports-and-functionality/project-related-reports-and-fuctionality/tuning.md#raw-export)
* [Cohort export](#cohort-export)
## **Paying capacity**
In devtodev all paying users are divided into 5 segments by their payment amounts: **minnows, dolphins, grand dolphins, whales and grand whales**. These segments can be applied to the reports and dashboards and used as filters in order to analyze metrics of app performance for each user segment.
Also, such division might be helpful to see the distribution of your users by segments.
This page helps you specify payment intervals for each segment of users separately. Payments are measured in US dollars.
## Cheaters & Testers
This section shows all the users that are marked as Cheaters or Testers. You can export a list of such users in a file and quickly unmark a selection of users.
### Actions with the list of users
Click on the `pencil` icon to open the configuration wizard. Here you can mark or unmark specific users.
1. Select the action you want to perform: `mark` or `unmark` the users.
2. Select the user identifier type: `devtodev Id`, `Main Id`, `Advertising Id` or `User Id`.
3. You can upload a CSV file with the list of identifiers. Or you can enter the necessary IDs in the text field using a comma as a separator.
Upload a list with IDs
Enter IDs manually
In case you mark users as Cheaters (or Testers), after you click OK, the users will be tagged and their payments will be removed from the reports containing financial metrics.
## **Labels**
The **Labels** section allows you to manage time labels by adding marks on a timeline. These marks can be one-day or long-term events which can be specified as duration of in-game events, sales, update of app version, etc.
{% hint style="info" %}
Labels can help you to monitor abnormal changes and identify the cause of it in a specific time period.
{% endhint %}
All specified labels can be presented in two ways:
* Calendar view
* Table view
You can create new labels by clicking `Add label` button in the top right corner. Each label can be customized using preset or your own categories.
Labels will appear on dashboard widgets. You can disable them in widget **Chart settings**.
## **Alerts**
By setting up alerts, you will always stay tuned and you will be able to monitor game metrics changes without getting into the system. You will be notified automatically in case of any changes in your main metrics, so you can act on them quickly.
This page will help you to set up alerts in 4 steps.
1. Specify a metric, its condition type and sensitivity.
**Supported metrics**: Active users, ARPPU, ARPU, Average number of custom events per user, Day 1 Retention (calendar), Day 7 Retention (calendar), Gross, New users, Number of custom events, Paying share, Paying users.
**Condition types**:
* comparison with confidence interval (the previous day’s value will be compared to the confidence interval). You indicate the sensitivity parameter: high, medium, or low. This choice affects whether the confidence interval widens or narrows.
* comparison with threshold (the previous day’s value will be compared to the specific value). You provide one or two threshold values for the metric: Upper threshold value and Lower threshold value.
* сomparison with the previous day. You enter the percentage value by which the metric should change to trigger an alert, compare the value of the past day with the day before.
* сomparison with the same day last week. You enter the percentage value by which the metric should change to trigger an alert, compare it with the same day of the last week (for example, Monday with Monday).
2. Customize preferable notification channels. You can choose to notify via e-mail, devtodev notification or Slack messages. It is important to add at least one addressee or webhook.
3. Choose notification delivery time (based on Europe/Moscow time zone). You can customize the start date and decide whether alert campaign will expire or not on a particular date.
4. Give a name to your alert to be able to differentiate it from the other ones.
The `Finish` button will complete the configuration of your devtodev notifications.
## Integration
### Custom event configurations
In this section you can rename the event and parameters without changing them in code. It will allow you to save time for bug fixing if there are some mistakes in naming.
You can also ‘block’ some events to stop collecting and storing their data.
Please note, only users with roles like Admin or Owner can edit custom events. The rest of the roles only have access to viewing. You can change role permissions in the [Users & Access](/space-management.md#users-and-access) section. \
\
At the top of the report you can see the custom events overview:
* **Active custom events** – events we are tracking and recording at the moment. These events are available in all reports.
* **Events blocked by customer** – events which were implemented in the code but were blocked by the space administrator or space owner. We are not collecting and recording data for these events at the moment. You will not see such events when building reports.
* **Events blocked by system** – events that were blocked by devtodev because they exceeded the limit of unique event names. The [limit is different](/data-management-and-limits.md) depending on the price plan.
Under this overview block, you can see the list of active and blocked custom events. The table contains the following infromation about the event:
* **Event name** – click on the name to open a detailed [event page](#event-page).
* **Event alias** – you can rename an event in devtodev without changing the name in code. Please note that the alias cannot be the same as other event names or aliases.
* **Event description** – you can add a description to an event and its parameters so it is easier to understand themeaning behind it. To make this process easier, you can enable [AI descriptions](#ai-descriptions) and the system will generate the descriptions automatically.
* **Created** – date when devtodev first received the event.
* **Params used** – number of active parameters in the event.
* **Blocked params** – number of plocked parameters.
* **Number of events (last 7 days)** – total number of the events received in the last 7 days.
* **Number of users (last 7 days)** – number of users who completed these events in the last 7 days.
* **Events by user (last 7 days)** – average number of events by user (calculated as the total number of events divided by the number of unique users).
* **Status** – this field will specify the reason why an event is blocked.
* `Lock` button – use this button to unblock the event.
#### AI descriptions
Toggle the switch to enable AI descriptions for custom events and parameters. Please note that generetion for new events might take some time.
AI-generated descriptions will have a stars icon next to the text so you can quickly identify such descriptions.
You can edit the AI description. Click on the `pencil` icon to edit the description and save the changes. When you update a generated description, the stars icon will dissapear.
You can remove AI-generated descriptions. Simply toggle the switch and click `Remove descriptions`.
#### Event page
Click on the event in the list to see all the details about its status, parameters and description.
On the event page you can rename the event (add alias), add or edit descriptions for the event and parameters. You can also block or unblock the unnecessary parameters or the event by clicking the `lock` button.
There is a [limit to the number unique event names](/data-management-and-limits.md) that we can track simultaneously. If you reach the limit, you can block those active custom events that are currently irrelevant.
We will start collecting data for this event again only after you unblock it.
{% hint style="info" %}
Please note that you can unblock events from the **Blocked events** list if your number of active events is less than the limit.
{% endhint %}
### User properties
In this section you can ‘block’ certain user properties to stop collecting and storing their data.
Please note that only space administrators or a space owner can edit custom properties. Other roles have only access for viewing. At the top of the report, you can see the overview of user properties:
* Active custom user properties – properties we are currently tracking and recording. These properties are available for all reports.
* Properties blocked by customer or system – properties that were implemented in the code but were blocked by the space administrator or space owner. We are not collecting or recording data for these properties at the moment. You won't see these properties when building reports.
There is a limit of 30 unique property names that we can track simultaneously. If you reach the limit, you can block those active custom properties that are currently irrelevant.
To block or unblock multiple properties, you can mark the checkboxes and then click on the lock icon.
We'll start collecting data for this property only after it is unblocked.
{% hint style="info" %}
Please note that you can unblock a property from the blocked list if you have fewer than 30 active custom properties.
{% endhint %}
### System alerts
In order to provide you with the correct data in the reports and make them insightful for you, we will keep you informed about different errors and issues in the data such as achieving the events or parameters limit and errors connected to the integration or tracked data. These notifications could contain information about the following issues:
* transactions exceed the limit by the amount of payment;
* events with the same name but different register are tracked;
* number of currency types are about to reach the limit;
* some transactions are doubled;
* and more.
Notifications about errors and different warnings are displayed in the Notification section in the right upper corner.
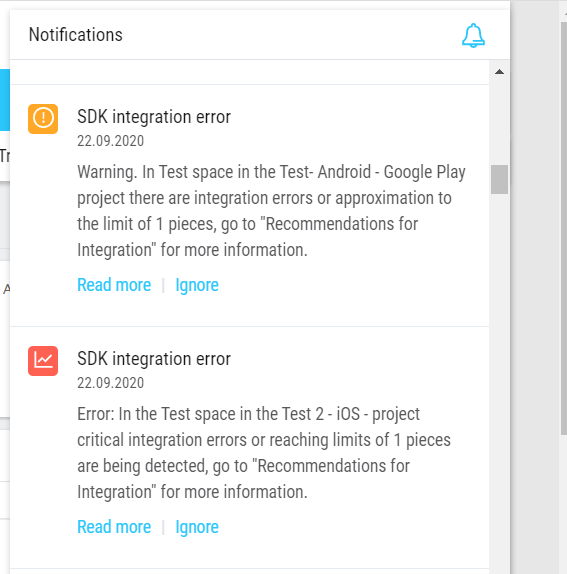
More details about each of them are available under the `Read more` button. After you tap it, you will be redirected to the **System alerts** sections where you can find the following:
* list of all errors and warnings of the current application version;
* a detailed description of the errors and documentation links with information about the limits and integration best practices.
You can also postpone the notifications for 7 days by using the `Remind later` button in the Notification section. After 7 days we resume sending notifications if the error or the warning persists.
By default, error notifications are sent to users with owner or admin rights. They can subscribe to notifications users with different permissions or unsubscribe them. To do this, at the top of the System alerts page in the Tuning - Integration section you need to click on the pencil icon, select a user from the list and click `Apply`:
## Raw Export
The **Raw Export** section allows you to build custom reports and download them as csv. files. This may be needed if you want to work with data on your own and build more complex and customized reports.
To create a new report, click the `Add a new report` button above the table and follow the instructions.
* Choose events and data
* Select time frame for the report
* Name your report
To download an existing report, find it in the table and click `Download` in the right column of the table. The report will be downloaded to your computer.
You can download the reports with only "Ready" status. If a report is in a "In progress" status, wait until it reaches 100%. If the report is in an "Empty report" status, it means that there is no relevant data to be exported.
After the report is created, you can see its settings by clicking the button in the “Settings” column.
{% hint style="info" %}
Please note that reports will be available for downloading only during 14 days after their creation.
{% endhint %}
### List of available events
You can find description of each event table in [this section](/integration/server-api/raw-export.md#list-of-available-events).
## **Cohort export**
### Set up integration
Export your cohorts to Google Ads and Facebook to use the audiences for ad targeting. [To start the integration](/3rd-party-sources/cohort-export.md), open Settings → 3rd party sources → Cohort export.
### Prepare a cohort for export
Use the following reports to export audiences:
[**Segments**](/reports-and-functionality/project-related-reports-and-fuctionality/users.md#segments): select a dynamic or static segments and click `Export cohort to Ad network` in the top right corner. Dynamic segments can be synced Daily.
[**SQL**](/reports-and-functionality/space-related-reports-and-functionality/sql.md): get a list of user IDs (`devtodevid` field) as a result of your query. Click `Export cohort to Ad network` in the top right corner of the results table to export the cohort to your ad account.
[**Users**](/reports-and-functionality/project-related-reports-and-fuctionality/users.md): filter users by parameters, properties, completed events, then click three dots in the top right corner and select `Export cohort`.
[**Paying status prediction**](broken://pages/-M-Q4A-dWkVD_iFOrZwx#payment-prediction) report: select a segment with a certain purchase probability and click the `Export cohort` button.
[**RFM**](/reports-and-functionality/project-related-reports-and-fuctionality/smart-view/monetization-reports.md#rfm-analysis) report: select the desired segment, e.g. Champions – the users who pay often and a lot, and click the `Cohort export` button.
[**Funnels**](/reports-and-functionality/project-related-reports-and-fuctionality/events-and-funnels.md#conversion-funnels) report: build a funnel and export the audience who completed specified steps by clicking `Export cohort of step-completers` in the dropdown menu.
### Exporting a cohort to an ad account
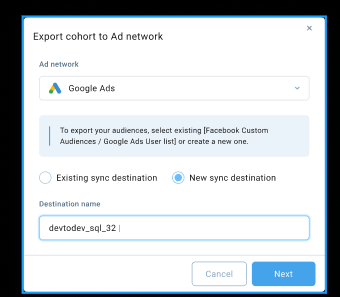
1. After you have prepared an audience to export and clicked `Export cohort to Ad network` in the new window, you need to choose whether you want to add new users to an existing audience in your ad account or build a new one. To create a new cohort, enter the name to be displayed in the ad network account.
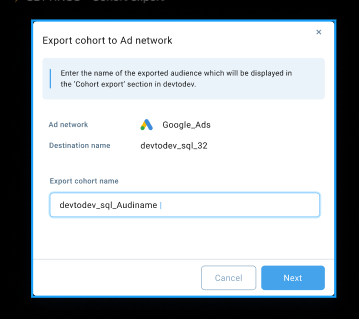
2. Next, you need to name the exported cohort. This name is displayed in devtodev in the list of all exported cohorts. This is needed for history and cohort management.
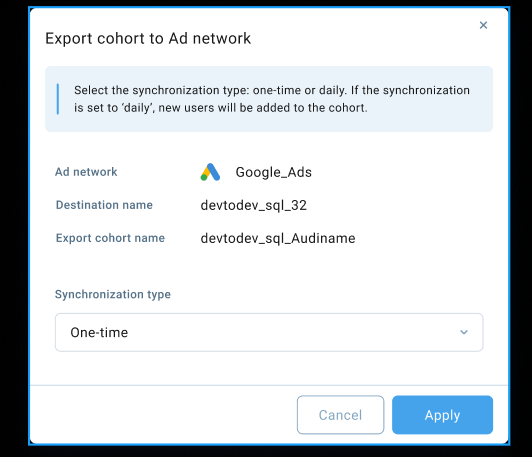
If your cohort was created from a dynamic segment, then on the next step, you will need to select the type of cohort synchronization: **Daily** (the audience gets exported every 24 hours) or **One-time**. \
If you choose daily synchronization, then users will accumulate in the cohort and the users who left the dynamic segment will not be removed from the cohort.
3. Click `Apply` to finish audience export. Audience creation can take up to 12 hours to full completion. You can find the cohort synchronization status in the Cohort list (Tuning -> Cohort export).
The **Cohort export** section contains information about exported cohorts:
* Name – cohort name in devtodev interface and ad network, where the cohort is exported.
* Destination name – where the cohort was created.
* Last syncing – date of the last synchronization for daily sync. For one-time export – date of cohort creation.
* Audience size – number of sent identifiers.
* Status – created, synchronization or sent.
* Type – audience type: one-time export or daily export.
* Action – use this to cancel syncing daily cohorts.
---
# Agent Instructions
This documentation is published with GitBook. GitBook is the documentation platform designed so that both humans and AI agents can read, navigate, and reason over technical content effectively. Learn more at gitbook.com.
## Querying This Documentation
If you need additional information that is not directly available in this page, you can query the documentation dynamically by asking a question.
Perform an HTTP GET request on the current page URL with the `ask` query parameter, and the optional `goal` query parameter:
```
GET https://docs.devtodev.com/reports-and-functionality/project-related-reports-and-fuctionality/tuning.md?ask=&goal=
```
`ask` is the immediate question: it should be specific, self-contained, and written in natural language.
`goal` is optional and describes the broader end goal you are ultimately trying to accomplish on behalf of the user. GitBook uses it to tailor the answer towards what is most useful for that goal.
The response will contain a direct answer to the question and relevant excerpts and sources from the documentation.
Use this mechanism when the answer is not explicitly present in the current page, you need clarification or additional context, or you want to retrieve related documentation sections.