> For the complete documentation index, see [llms.txt](https://docs.devtodev.com/llms.txt). Markdown versions of documentation pages are available by appending `.md` to page URLs; this page is available as [Markdown](https://docs.devtodev.com/scenarios-and-best-practices.md).
# Scenarios and Best Practices
## **Analysing monetization**

### Conversion to payments
The goal is to have paying users who will return to the game as often as possible. To do this, we must analyze Retention. We will analyze it a little bit later, but for now let's see what is our Conversion to the first payment. The [**Conversion to payments**](/reports-and-functionality/project-related-reports-and-fuctionality/smart-view/monetization-reports.md#conversion-to-payments) report will help us with this.
We can compare the conversion to the first payment by applying to the report the segments of users who pass the tutorial and those who missed it. It is possible that users whom we brought to the store during the tutorial pay us more and more often than users who refused to study.
Segmentation can be applied to all reports, see the data in the context of various events and in the context of users. Using user segmentation allows you to get more insights from reports.
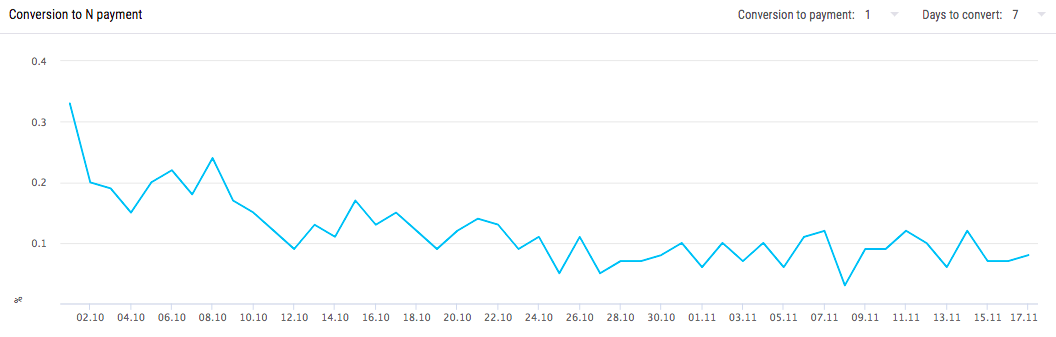
Let's see how quickly users begin to pay: at the first day or a few days after installation when they better understand the game. So we can determine which day it is worth planning marketing activities to increase the likelihood of payment.

The graph shows that the majority of the first payments are made in the early days, which means we can show users a special offer almost immediately.
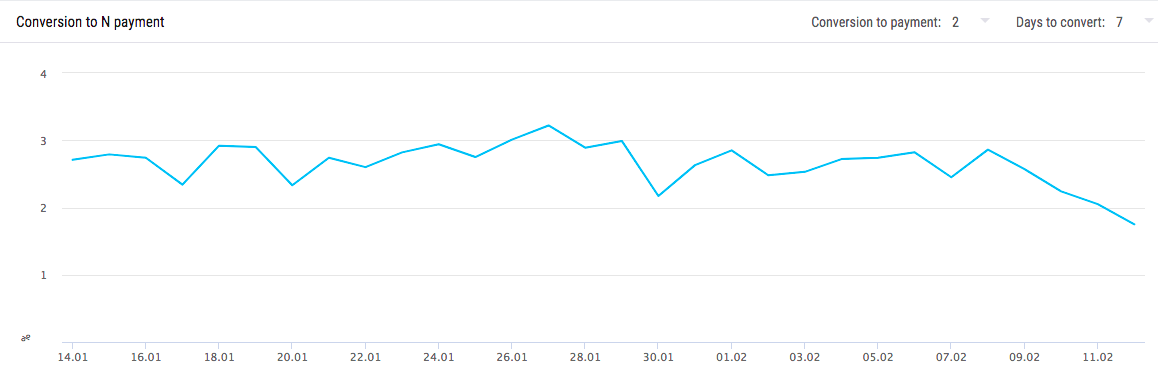
It is clear with the first payment, but it’s also important to ensure that users who make the first payment do not stop there. Let's see if the users continue to make subsequent payments, because often repeated payments bring more income, which we could see in the table above. In the same **Conversion to payments** report, we analyze the conversion to subsequent payments:
### RFM analysis
After that, we should look at the structure of paying users to evaluate how often, how long and how much users have paid us, we can see it in the [**RFM analysis**](/reports-and-functionality/project-related-reports-and-fuctionality/smart-view/monetization-reports.md#rfm-analysis) report.
* The segment **Can’t Lose Them**. These customers made the biggest purchases, and made them often. But they haven’t returned for a long time. Try to win them back by offering them renewals or newer offers, features. There is a chance to lose them to competition, try talking to them.
* **Loyal Customers**. Customers who spend often good amounts of money. They are responsive to promo activities. Try to upsell higher value products. Ask for reviews and think how you can engage them.
* **Сhampions.** Customers who bought recently, buy often and spend the most money. Try to reward them. These customers can be early adopters for new offers and features. They will promote your app.
* **At Risk.** These customers spent big sums of money and made purchases often but a long time ago. You need to bring them back. Try to reconnect with customers by sending them personalized push notifications, offering renewals, and providing helpful resources.
* **Need Attention.** Customers in this segment have above average recency, frequency and monetary values. They may not have made purchases very recently though. Try making time limited offers, recommend based on past purchases, and reactivate them.
* **Potential Loyalists.** These are recent customers who spent a good amount and made purchases more than once. Try offering membership or loyalty programs, and recommend other products.
* **Hibernating.** Last purchase by these customers was a long time ago. They are low spenders and have a low number of orders. Try offering them other relevant products and special discounts. You can also promote new features and modes.
* **About To Sleep.** Customers have below average recency, frequency and monetary values. You will lose them if they remain not reactivated. Try sharing valuable resources, recommend popular products, renewals at discount, and reconnect with them.
* **Promising.** These customers are recent payers but they haven’t spent much. Try making time limited offers and persuade them to use the app more frequently.
* **New Payers.** These users have just converted to payers. Try engaging them to use the app more frequently and give them bigger discounts.
### Gross structure
Now let's look at the structure of our audience in the [**Gross structure**](/reports-and-functionality/project-related-reports-and-fuctionality/smart-view/monetization-reports.md#gross-structure) report, segmenting it into beginners and oldies. Our audience is divided into six segments by the registration time:
It can be seen that we are dominated by old users. Perhaps, it’s worth attracting new traffic to our game. With an increase in traffic, the number of paying audience also increase.
If there were more new users, it would be worth thinking about retaining new users.
We figured out the structure of the audience. Let's see what happens with the dynamics of paying users:
The graphs show that users who register 1 months ago and earlier pay less and less. This may indicate an oversupply of currency. You can also notice the uneven distribution of income from beginners, most likely, at the peak there was a campaign for beginners. Perhaps it is worth concentrating marketing communications specifically on new users.
And at what level do users start paying us? Let's go back to the **Conversion to payments** report and see at what level the user most often makes the first and the second purchases:
Thanks to this information, we understand when to motivate the user to buy.
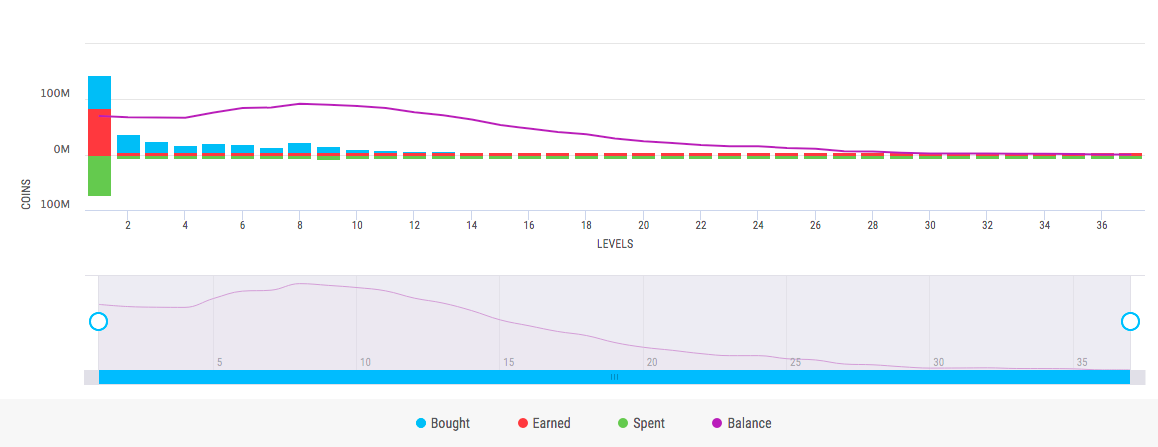
### Economy balance
Let’s evaluate how the game economy is balanced at each level. Let's go to the [**Economy balance**](/reports-and-functionality/project-related-reports-and-fuctionality/smart-view/in-game-analysis-reports.md#economy-balance) report, it will show the average and total accumulations, purchases, expenses and earnings for each game’s level.
## Analysing retention
Now let's see check retention:

We will check the traffic to see if we buy that users that we need. The [**Basic Metrics**](/reports-and-functionality/project-related-reports-and-fuctionality/events-and-funnels.md#basic-metrics) will help us with the traffic analysis.
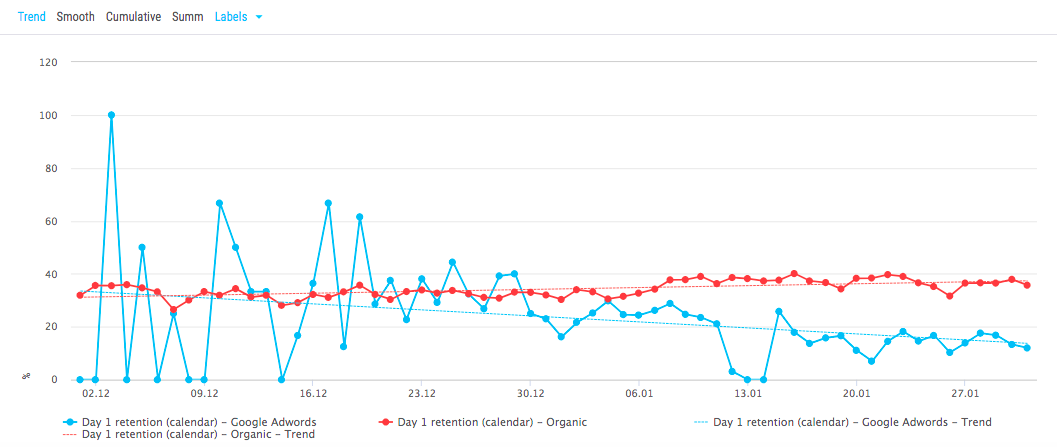
The report shows that traffic from google adwords has a downward trend line, on the contrary, organics are growing. Users from different sources perceive our game differently.
It is also worth to segment reports when analyzing by platform, traffic sources, country, version and other criteria, as the behavior of different categories of users may differ.

We will check what is our game’s retention, whether it’s always been at this level. Let’s go to the [**Engagement** **dashboard**](/reports-and-functionality/project-related-reports-and-fuctionality/smart-view/engagement-reports.md) or **Basic Metrics.**
We see that retention has begun to decline, but maybe the problem is not in all versions of the game. [**Cohort analysis**](/reports-and-functionality/project-related-reports-and-fuctionality/smart-view/cohort-analysis.md) and [**App versions** **analysis**](/reports-and-functionality/project-related-reports-and-fuctionality/smart-view/engagement-reports.md#app-versions-analysis) will help with this. In the **App versions analysis**, we will see the audience, the distribution of users across all versions of the game, how they go through the tutorial, users’ deduction and the amount of payments by game’s version.
In the [**Cohort analysis**](/reports-and-functionality/project-related-reports-and-fuctionality/smart-view/cohort-analysis.md) we compare the behavior of different cohorts with different registration dates. Let's see how cohort / segment retention rates change, what is the average check and other metrics:
What kind of retention do we need to check?

### Short-term retention
If the problem is with short-term retention, the [**Tutorial analysis**](/reports-and-functionality/project-related-reports-and-fuctionality/smart-view/engagement-reports.md#tutorial-analysis) reports will help us.
### Medium-term retention
How are things going with medium-term retention? Let’s take a look at the report on levels’ difficulty. We should go to the [**Game structure**](/reports-and-functionality/project-related-reports-and-fuctionality/smart-view/in-game-analysis-reports.md#game-structure) report:
### Long-term retention
What about long-term retention? First, let’s take a look at the [**Cohort analysis**](/reports-and-functionality/project-related-reports-and-fuctionality/smart-view/cohort-analysis.md) report:
We can also build a sequence of users’ actions, for example to see what they do after a push about a new event in the game. To do this, go to the [**User flow**](/reports-and-functionality/project-related-reports-and-fuctionality/smart-view/engagement-reports.md#user-flow) report and set the event from which we want to build the analysis:
To analyze whether users enter events, watch ads, interact with other users, add friends and etc., you should go to the [**Custom events**](/reports-and-functionality/project-related-reports-and-fuctionality/events-and-funnels.md#custom-events) report:
---
# Agent Instructions
This documentation is published with GitBook. GitBook is the documentation platform designed so that both humans and AI agents can read, navigate, and reason over technical content effectively. Learn more at gitbook.com.
## Querying This Documentation
If you need additional information that is not directly available in this page, you can query the documentation dynamically by asking a question.
Perform an HTTP GET request on the current page URL with the `ask` query parameter, and the optional `goal` query parameter:
```
GET https://docs.devtodev.com/scenarios-and-best-practices.md?ask=&goal=
```
`ask` is the immediate question: it should be specific, self-contained, and written in natural language.
`goal` is optional and describes the broader end goal you are ultimately trying to accomplish on behalf of the user. GitBook uses it to tailor the answer towards what is most useful for that goal.
The response will contain a direct answer to the question and relevant excerpts and sources from the documentation.
Use this mechanism when the answer is not explicitly present in the current page, you need clarification or additional context, or you want to retrieve related documentation sections.