> For the complete documentation index, see [llms.txt](https://docs.devtodev.com/llms.txt). Markdown versions of documentation pages are available by appending `.md` to page URLs; this page is available as [Markdown](https://docs.devtodev.com/scenarios-and-best-practices/non-gaming-app.md).
# Non-gaming app
## **Basic metrics**
{% content-ref url="/pages/-M-L22sfVUbFqNl\_hRLi" %}
[Real-Time Dashboard](/reports-and-functionality/project-related-reports-and-fuctionality/smart-view/real-time-dashboard.md)
{% endcontent-ref %}
The reports in the devtodev system are universal and suitable not only for games but also for detailed analysis of non-gaming applications. The system enables you to analyze both the main project metrics: DAU / MAU / WAU, retention, and monetization metrics like income, ARPU, ARPPU, as well as to conduct a more detailed analysis of user behavior.
The **Real-time dashboard** shows key metrics of the current day compared to the previous day. It helps you to keep track of your app’s performance in real time. The report allows you to quickly track changes in the application audience: New users, Cumulative new users, Sessions, Cumulative sessions, Users online. It also allows you to compare today’s indicators of Gross, Cumulative gross, Top countries (by new users or by gross) with yesterday’s.
Thus, you can get live data reports and observe the performance of important project indicators. The information in the report is updated every five minutes.
## Acquisition reports
{% content-ref url="/pages/-M-Q2WoN1VYsK1ayBO5o" %}
[Acquisition reports](/reports-and-functionality/project-related-reports-and-fuctionality/smart-view/acquisition-reports.md)
{% endcontent-ref %}
You can analyze the effectiveness of user acquisition. **Acquisition reports** answer the following questions: how many users each channel brought, which one is the most profitable, how many users keep using the application after a day, a week, two, etc. and when will this traffic pay off. You can [integrate traffic attribution services](/3rd-party-sources/3-rd-party-attribution.md) such as Appsflyer, Tune, Branch, Kochava, Adjust, and Tenjin to get install information.
## Monetization
The reports in the [**Monetization**](/reports-and-functionality/project-related-reports-and-fuctionality/smart-view/monetization-reports.md) section give information about the key monetization metrics of your project. For example, you can monitor the dynamics of ARPU, Paying share, ARPPU, Gross. You can also find useful information about users’ repeated purchases and the time between purchases. You can find out on which day users make purchases in your application more often and use an offer to nudge them to buy on that day.
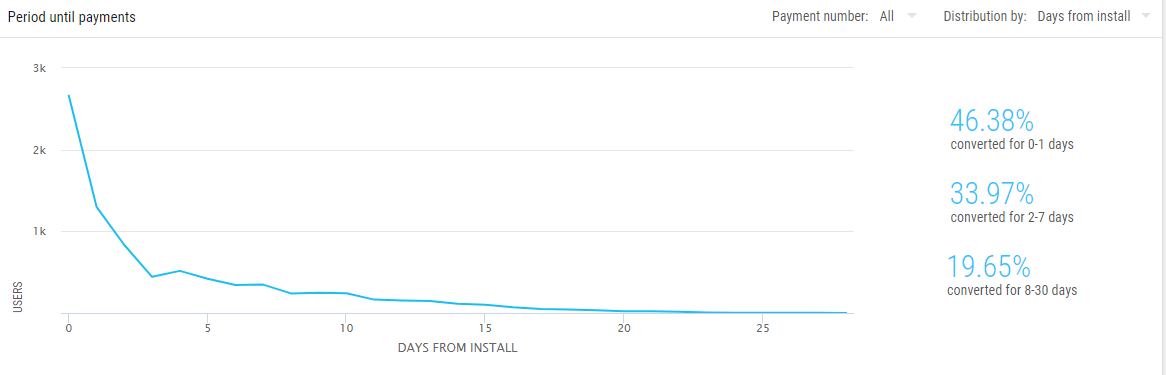
You can also study the structure of your paying audience and income from a perspective of the time that has passed since the installation.
Using the RFM analysis report, you can segment your paying audience by their purchasing patterns. This way you can improve retention and increase revenue by re-engaging inactive paying users.

### In-App Purchases
In order to view the data in the Monetization Dashboard, Gross Structure, Conversion to Payments, RFM Analysis, Transactions Number, Transactions reports, you need to integrate **Payment** event transmission. You must send this event immediately after the platform confirms that the payment went through successfully. Learn more about the [Payment event integration](/integration/integration-of-sdk-v2/setting-up-events/basic-methods.md#real-payment).
### Ad revenue
If your app uses the ad monetization model, you can[ integrate ad networks](/3rd-party-sources/ad-revenue.md) to get access to the [**Ad monetization**](/reports-and-functionality/project-related-reports-and-fuctionality/smart-view/monetization-reports.md#a-d-monetization) report. The report will help you evaluate how users interact with ads in your app, analyze the most in-demand metrics of ad performance such as ad revenue, eCPM, ad impressions, average number of ad impressions per user and the number of ad clicks per user.
In case you use IronSource or Applovin MAX, you will get access to more detailed statistics. You can find out more about the report [here](/reports-and-functionality/project-related-reports-and-fuctionality/smart-view/monetization-reports.md#advanced-report).
### Subscriptions
If your app uses a subscription monetization model or a mixed monetization model, you can choose the exact income source to calculate the financial metrics: subscriptions, ads or one-time purchases. You will also have access to a [**subscription monetization report**](/reports-and-functionality/project-related-reports-and-fuctionality/smart-view/monetization-reports.md#subscriptions):
The report includes widgets that display the number of new users, new trial users, subscribers and their daily conversions, conversions from trial version to subscription, subscription retention rates, the structure of purchased subscriptions, income, etc.
You can also filter users or metrics by the current status of their subscription – **Subscription state**. For example, you can select the users who canceled their subscription and send them a push notification with an engaging offer to drive them to renew their subscription.
## **Segmentation**
{% content-ref url="/pages/-M-Q49\_4LnsEVtgVl6AA" %}
[Users & Segments](/reports-and-functionality/project-related-reports-and-fuctionality/users.md)
{% endcontent-ref %}
User segmentation is an important and useful process in mobile application analysis. Sometimes, hypotheses based on information about all users can lead to incorrect conclusions. The larger the audience of your project, the less homogeneous it is. Therefore, using user segmentation, you can analyze the segments in comparison with each other. For example, you can compare the rates of authorization conversion funnels for different countries.
### Static segments
There are two types of segments: static and dynamic. A static segment consists of a specific list of users who perform a specific number of events. A static segment can be created using the conversion funnels section, and the list of users will not be updated:
### Dynamic segments
It is also possible to create a dynamic segment; this list of users will be updated every time new users perform an event specified in the segment parameters. You can create it by going to the **Users & Segments** tab, and then to the **Segments** section:
Once segments have been created, they can be used in reports and dashboards in the same way as filters. For example, you can compare the behavior and metrics of users who completed a tutorial with those who skipped it.
## **Engagement**
{% content-ref url="/pages/-M-Q2xeUiNqJdjdrTePG" %}
[Engagement reports](/reports-and-functionality/project-related-reports-and-fuctionality/smart-view/engagement-reports.md)
{% endcontent-ref %}
The **Engagement** section enables you to analyze user behavior, retention, and engagement.
[**Tutorial Analysis**](/reports-and-functionality/project-related-reports-and-fuctionality/smart-view/engagement-reports.md#tutorial-analysis) shows a tutorial steps funnel, as well as the number of users who successfully completed, did not complete, or skipped the tutorial. Using this report, you can identify bottlenecks in your tutorial.
In order to build a funnel of tutorial progression steps, you need to integrate the basic [**Tutorial step**](/integration/integration-of-sdk-v2/setting-up-events/basic-methods.md#onboarding-tutorial) event. This event should be sent at the end of each tutorial step with the number of each completed step as a parameter.
The [**Retention**](/reports-and-functionality/project-related-reports-and-fuctionality/smart-view/engagement-reports.md#retention) report shows you the percentage of users who opened your app on a selected day after the first launch. This way you can gauge the loyalty to your product and understand when users stop using it.
In the [**Audience structure**](/reports-and-functionality/project-related-reports-and-fuctionality/smart-view/engagement-reports.md#audience-structure) report, you can analyze the structure of your audience divided into different groups according to the following parameters: App versions, Country, Devices, Paying capacity (free / minnows / dolphins / grand dolphins / whales / grand whales), Paying status (paying / free), Returning users (new users / returning users).
You can also compare [**application versions**](/reports-and-functionality/project-related-reports-and-fuctionality/smart-view/engagement-reports.md#app-versions-analysis) – this is useful in the first days after the release of a new version of the application to make sure that in the updated version the main user action funnels have not been worsened or made more complex. You can compare the metrics of users going through the tutorial, their retention, and income across product versions.
### **Push notifications**
One of the methods of re-engaging users and boosting retention in your application is sending them push notifications. You can use this built-in functionality and compare the metrics of users who received a notification with those who did not.
To implement the push notification service, you need to:
1. Integrate devtodev SDK and activate push notifications during integration execution.
2. Fill in the required information in the push notifications panel in the Integration section of the application settings. You can get more detailed information here:
{% content-ref url="/pages/-M-Q4AWHh2YwhaWlZt3o" %}
[Push Notifications](/reports-and-functionality/project-related-reports-and-fuctionality/experiments/push-notifications.md)
{% endcontent-ref %}
## **Custom events**
In addition to analyzing data using the main reports, which are based on [basic events](/basic-events-and-custom-events.md), you can integrate [custom events](/basic-events-and-custom-events.md#custom-events) to track and analyze specific user actions. By using custom events, you can find out what users do in the application, what functions are most popular, how they use various filters, change settings, which buttons press, whether they communicate with other users, whether they share your application with friends, and much more.
For example, an event that gives you information about the most preferred login methods used in your application: Event name authorization Parameters method, e.g., fb, method (string) – authorization method: social networks, email.
You can analyze custom event data in the [Custom events](/reports-and-functionality/project-related-reports-and-fuctionality/events-and-funnels.md#custom-events) report. You can also build a funnel and analyze the conversion at each stage, for example, you send the steps of purchasing goods in your application. Based on these events, you can build a funnel and use the [Conversion funnel](/reports-and-functionality/project-related-reports-and-fuctionality/events-and-funnels.md#conversion-funnels) report to see the conversion at each stage. This will allow you to find the stages where you are losing potential customers.
## Cohorts
{% content-ref url="/pages/-M-Q3EeJswmHozwuyjYU" %}
[Cohort analysis](/reports-and-functionality/project-related-reports-and-fuctionality/smart-view/cohort-analysis.md)
{% endcontent-ref %}
To assess the dynamics of product quality, you can use **Cohort analysis** report that allows you to compare the behavior of different user cohorts (segments with different registration dates): how they are converted into purchase for the same period, how their retention rates change, how much they pay.
## Users
{% content-ref url="/pages/-M-Q49\_4LnsEVtgVl6AA" %}
[Users & Segments](/reports-and-functionality/project-related-reports-and-fuctionality/users.md)
{% endcontent-ref %}
The report allows you to get information about users. For each user you can see: basic properties, custom properties that are sent to the system, and information about user actions performed in the application.
For example, if you build a conversion funnel for user actions, you will see how users move through the selected stages, but you will not see interim optional steps. Users may not be able to find the right button at once. Thus, by eliminating needless steps, you can optimize and streamline the user's path to the desired action.

## **Levels**
Reports with grouping by levels or information about levels are rarely used for non-gaming applications, but still, you can divide user progress in your application into several levels by prioritizing the application functions, and send them to us.
If your project has a virtual currency, by using the [LevelUp](/integration/integration-of-sdk-v2/setting-up-events/basic-methods.md#level-up) event you can send information about the current amount of virtual currency in users’ possession.
To track virtual currency consumption and item popularity, add a [Virtual Currency Payment](/integration/integration-of-sdk-v2/setting-up-events/basic-methods.md#virtual-currency-payment) event transmission immediately after purchase. These events help you estimate the average amount of virtual currency that users have at a certain level. The event should be sent as soon as the user moves to the next level.
For example, if a user has registered, send information that they got to the first level, then after they have used filters when choosing an item, they earn some activity points, but don’t get to a new level. Or if the user made the first purchase, they are moved to another level, etc. ... This provides an opportunity to build reports and create new hypotheses to boost your metrics. Level transmission gives you access to the **In-game Analysis Dashboard**, **Economy Balance**, **Virtual Goods & Purchases**, and **Game Structure** reports (**Player levels** tab).
{% content-ref url="/pages/-M-Q35nOMjIkffWw7bI1" %}
[In-game analysis reports](/reports-and-functionality/project-related-reports-and-fuctionality/smart-view/in-game-analysis-reports.md)
{% endcontent-ref %}
---
# Agent Instructions
This documentation is published with GitBook. GitBook is the documentation platform designed so that both humans and AI agents can read, navigate, and reason over technical content effectively. Learn more at gitbook.com.
## Querying This Documentation
If you need additional information that is not directly available in this page, you can query the documentation dynamically by asking a question.
Perform an HTTP GET request on the current page URL with the `ask` query parameter, and the optional `goal` query parameter:
```
GET https://docs.devtodev.com/scenarios-and-best-practices/non-gaming-app.md?ask=&goal=
```
`ask` is the immediate question: it should be specific, self-contained, and written in natural language.
`goal` is optional and describes the broader end goal you are ultimately trying to accomplish on behalf of the user. GitBook uses it to tailor the answer towards what is most useful for that goal.
The response will contain a direct answer to the question and relevant excerpts and sources from the documentation.
Use this mechanism when the answer is not explicitly present in the current page, you need clarification or additional context, or you want to retrieve related documentation sections.